|
Follow the steps below to insert a column chart that displays your shopping expense data:
-
With your mouse, click-and-drag from A2 over to B2 and then down to the last item in your spreadsheet. You should now have
all of the data in Columns A and B selected. The title in Row 1 should NOT be part of your selection. The
Average Price, Highest Cost, and Lowest Cost items should NOT be part of your selection.
-
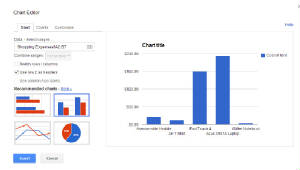
On the toolbar, click the INSERT button, and then choose CHART
-
Choose Column Chart from the list. – Google Spreadsheets will always recommend a few to choose from that work well
with your data type. More often than not, one of these recommendations is the one you’re looking for, but you can click
MORE if you can’t find Column Chart.
-
Click INSERT
-
Your chart will be created and placed in your spreadsheet
|